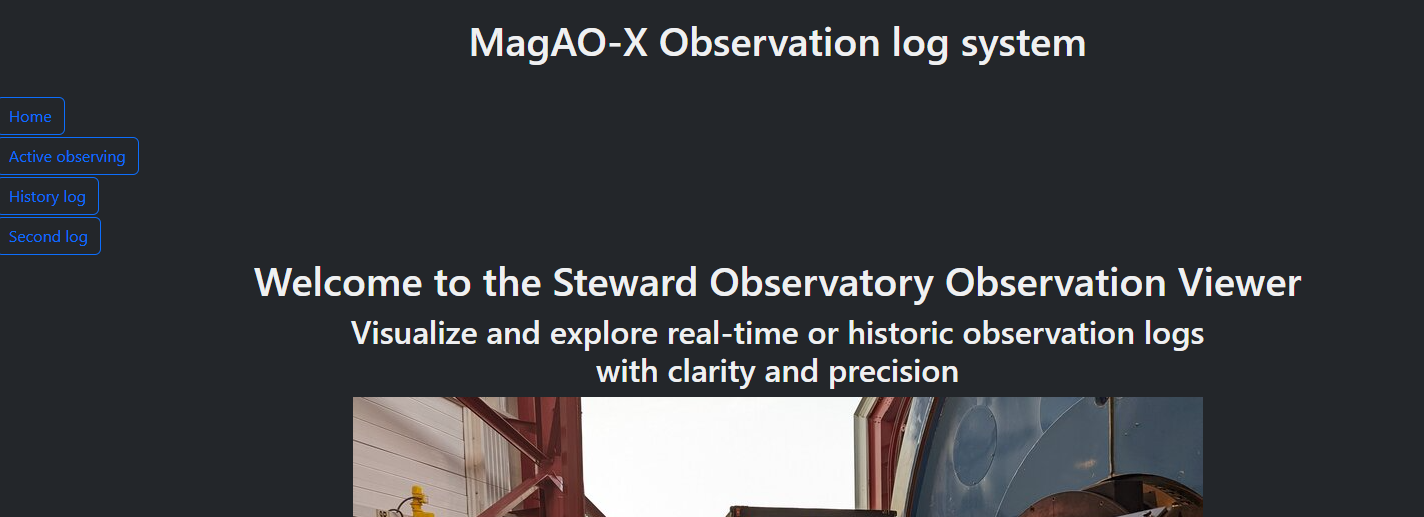
Observation Log App
This is an observation app that operates using a local Plotly web service running continuously on MagAO-X.
To open the user needs to navigate to 127.0.0.1:8050
The app will load directly to the homepage.
Choosing a Mode:
When the user opens the app and views the home page, there are three options: Home, Active observing, and History log. These three buttons are static and will be available on each page selected. Active observing is the only page that will automatically refresh during an observation period.
All tables default to show newest to oldest based on the timestamp, and all tables can be easily exported by selecting the ‘Export’ button on the top left of the table as shown below.
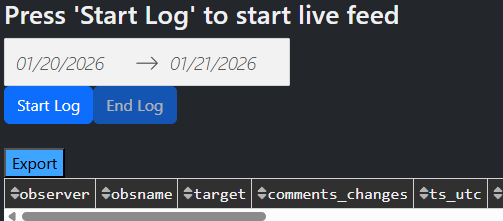
Live Observation Mode:
Use this during active observing from noon to noon. The date period is for reference only and cannot be manually changed. The dates will update automatically and at noon (1200) daily to accommodate a ‘new day’.
The user can initiate the log by pressing ‘Start log’, and ‘End log’ will stop the refresh cycle as shown above. The initial pull may be long if the log is refreshed deep into an observation, but it will dynamically speed up to prevent a bottleneck.
What the log does:
Listens for new telemetry and user logs and will update automatically
Appends only the data that has changed and will append the column name (device) and value into the ‘comments_changes’ column for quick reference.
Tracks observation windows in real time
When to use:
During nighttime operations
While configurations are changing
When adding observer notes
Do not refresh the page while live logging; always end the log.
Historical Observation Mode:
Use this to review past observations. The user must manually select the time range that they want. The larger the time range, the longer it will take for the table to populate, as more data needs to be queried and filtered.
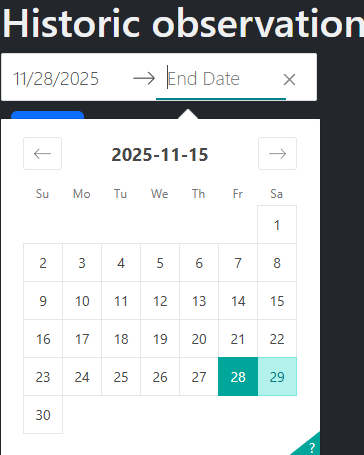
As with the live log data, the table will be shown from newest to oldest. Historic observations also have the added benefit of being able to reverse the order by column, such as time, obsname, target, etc.
What it does:
Loads a fixed date range
Reconstructs observation windows
Displays telemetry changes and user logs
Does not auto update
Observations crossing midnight are treated as continuous sessions.
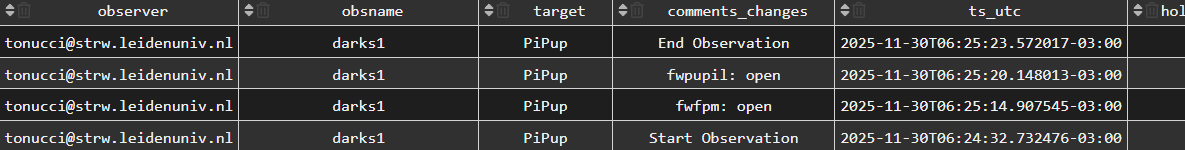
Telemetry Behavior:
The app shows state changes only.
Unchanged values are suppressed
Rapid changes appear as multiple entries
Missing entries usually mean no change occurred
This keeps the log readable and useful. Below is an example:
User Logs:
User logs are manual annotations using the ‘xlog’ function.
Use them to capture:
Observer intent
Reasons for changes
Conditions or anomalies
User logs appear with their own row in comments_changes along with the timestamp at which it was recorded.

Switching Modes:
Switching modes resets the session context.
Live → Historical:
Stops live updates
Clears live cache
Loads historical data
Historical → Live:
Initializes a new live session
Only new data is processed. If switching to live view during observation, the first load may take a moment to populate, depending on the amount of data needing to be filtered.
Do not switch modes mid-analysis unless you intend to reset the view.
Common Mistakes:
Mistake: Refreshing to get updates
Fix: Use live mode
Mistake: Interpreting repeated start markers as real restarts
Fix: Usually a backend issue in ‘observation_log.py’ or ‘active_observing.py’
Mistake: No telemetry is being displayed in the table or telemetry stopped updating
Fix: Stop / Start observation. If the table does not refresh and continue with new telemetry, dbIngest may need to be restarted.